Chapter 10: Evaporation Studies
A Class A pan was operated adjacent to Perry Lakes and a floating Class A pan was operated within East Lake. Open air swimming pools were also monitored as these effectively act as large sunken evaporation pans. Detailed monthly pan to lake coefficients are presented along with comparisons with other Class A pans operated by the Bureau of meteorology and others. The Perry Lakes data presented here represents one year for one wetland. Truly useful data can only be obtained from many years of consistent monitoring. Despite this, they are the only accurate lake-pan coefficients ever developed for Swan Coastal Plain wetlands. Due to their shallow depth, coastal wetlands have a low heat storage. Therefore the lake to pan phase lag should be much less pronounced than with deep water bodies and the errors from applying pan coefficients on a monthly basis should be reduced. This study represents the first attempt to accurately measure evaporation from a Swan Coastal wetland and provide accurate coefficients tied to the Bureau of Meteorology pan at Perth Airport.
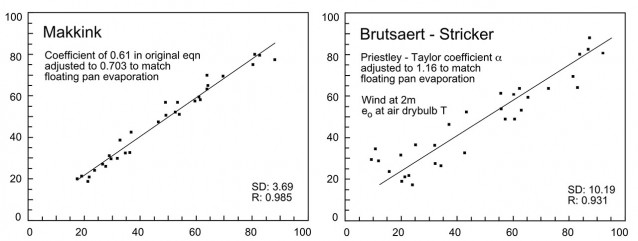
The second half of Chapter 10 is a detailed comparison of 10 commonly applied empirical equations for estimating evaporation or potential evapotranspiration. Equations tested were the Makkink, Stephens-Stewart, Jensen-Haise, Hamon, DeBruin, Mass Transfer, Penman, DeBruin-Keijman, Priestley-Taylor and Brutsaert-Stricker. Comparing methods on a balance period basis essentially shows how well the method copes with seasonal variations. All equations are essentially linear in form and can be adjusted against evaporation measured independently either by adjusting an existing coefficient or introducing a local coefficient of proportionality. Each equation was adjusted to produce a total annual evaporation equivalent to the floating Class A pan. Balance period totals were plotted against the corresponding floating pan data. The best and worst performers are shown below.

Best performer was the Makkink. SD is the standard deviation of the difference between floating pan values (x axis) and estimates derived from the equation (y axis). The Brutsaert-Stricker was the worst performer. Data points are balance periods 20 to 50 (December 22 1996 to January 3 1998).
Depending on what height wind run is taken and other factors such as using air or surface water temperature to calculate the saturated vapour pressure meant that some equations could be calculated in a number of different ways. Chapter 10 compares a total of 25 methods based on the 10 basic empirical equations noted above.

