Chapter 1: Introduction

Provides a general introduction to Perry Lakes and introduces the key concepts of lake-aquifer interaction. If you are not familiar with how water table lakes interact with the surrounding unconfined aquifer Section 1.5 provides a brief introduction. Chapter 1 also provides an outline of the thesis structure. Regardless of which sections of the thesis may interest you, Section 1.6 (and Figure 1.3) are recommended reading as they provided a concise outline of the research philosophy behind the project and a map of the thesis structure.

Chapter 2: History

Reviews the history of Perry Lakes since European settlement. Vegetation and water level regimes within Perry Lakes over the past century are reconstructed from botanical, air photograph, water level and flood remediation time series and anecdotal records. Historic records of climatic and groundwater changes in Floreat-Wembley area are reviewed. Chapter 2 includes historic photographs of Perry Lakes dating back to 1921. A more extensive (and better quality) gallery of historic photographs is available here.

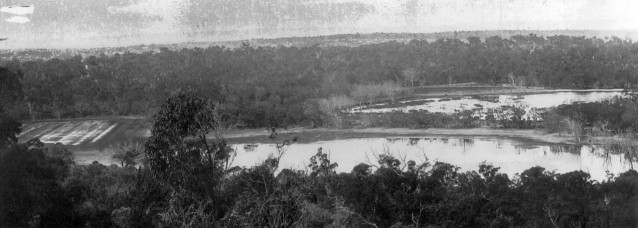
Panorama taken in 1921 from One-Tree (Reabold) Hill over West Lake (foreground) and East Lake (middle distance on the right).  The photo was taken during one of the wettest periods on record.  Dead mature trees around both lakes suggest a recent rise in water levels.  Formal water level monitoring at Perry Lakes (West Lake) commenced in 1963.  Copyright holder unknown, reproduced by permission Town of Cambridge.

Panorama taken in 1921 from One-Tree (Reabold) Hill over West Lake (foreground) and East Lake (middle distance on the right). The photo was taken during one of the wettest periods on record. Dead mature trees around both lakes suggest a recent rise in water levels. Formal water level monitoring at Perry Lakes (West Lake) commenced in 1963. Copyright holder unknown, reproduced by permission Town of Cambridge.

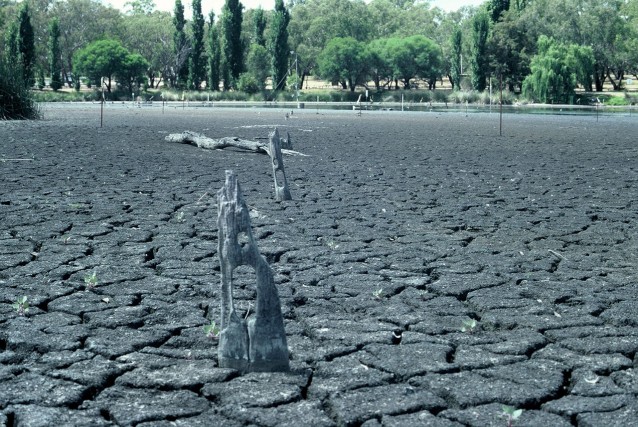
Storm water drains were constructed into the lakes in 1954 and extensive stripping of natural wetland vegetation and bank re-contouring comprised part of a ‘beautification’ program preceding the 1962 Commonwealth Games. Modification and degradation of the wetlands however dates back to the mid 1800’s when they were used for watering livestock. At low water levels remnants of old tree stumps and post and rail fencing are evident in both lakes.

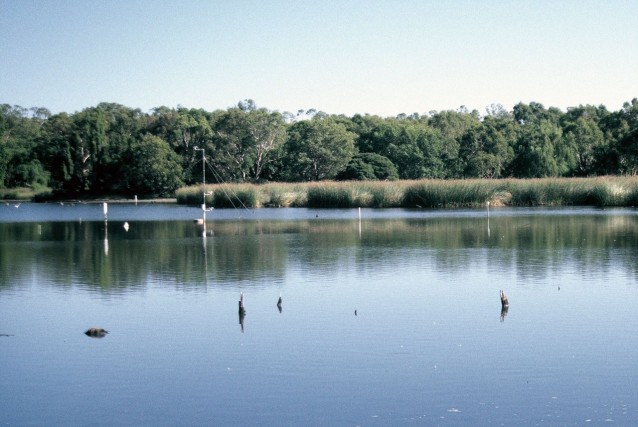
View looking west across the southern basin of East Lake.  White PVC pipes are thermistor strings, and surface, mid-level and bottom temperature loggers.  The anemometer mast is visible in the centre along with remnants of fencing and tree stumps, foreground.

View looking west across the southern basin of East Lake. White PVC pipes are thermistor strings, and surface, mid-level and bottom temperature loggers. The anemometer mast is visible in the centre along with remnants of fencing and tree stumps, foreground.

Remains of post and rail fencing, East Lake.  During summer the lake is artificially maintained.  Towards the approach of summer 1998 the wetland managers let the lake approach total dryness to assist with our lake-aquifer interaction studies (Refer Chapter 7).

Remains of post and rail fencing, East Lake. During summer the lake is artificially maintained. Towards the approach of summer 1998 the wetland managers let the lake approach total dryness to assist with our lake-aquifer interaction studies (Refer Chapter 7).

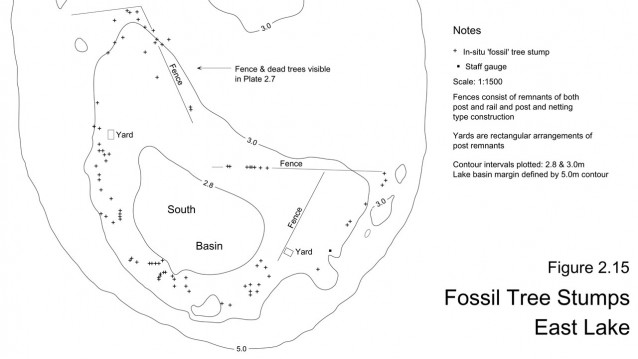
The data and photographic evidence suggest that the fences date either from Joseph Perry’s ownership (1880-1917) or the Birch brothers (1869-1880) who are known to have constructed extensive rail fencing. The trees most likely represent a period of sustained low summer water levels co-incident with dry conditions from at least 1876 (when records commenced) until about 1916. During this period only the central portion of the Southern Basin in East Lake sustained permanent inundation.

Post and rail fencing and stumps from trees which colonised the lake basin during a very dry period in the 1800’s.  Stumps are frequently preserved along the fence lines suggesting they grew while the fences were still serviceable.  Similar fence remains occur in West Lake.

Post and rail fencing and stumps from trees which colonised the lake basin during a very dry period in the 1800’s. Stumps are frequently preserved along the fence lines suggesting they grew while the fences were still serviceable. Similar fence remains occur in West Lake.

The fences were most likely constructed to prevent cattle becoming bogged in the mud. Their remains serve as proxy indicators of a dryer climate that preceded a much wetter period from 1920 to 1960.

Chapter 3: Physiology

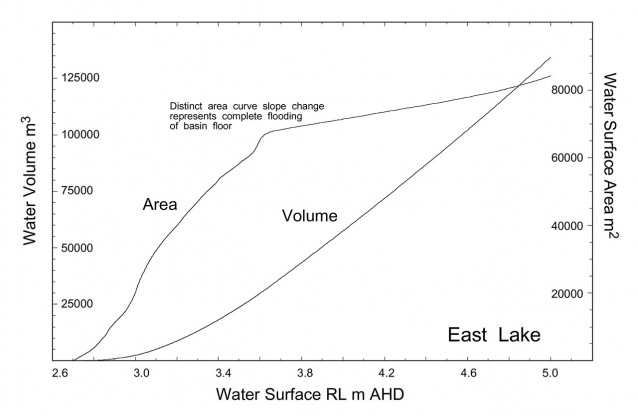
A summary of all the basic physical and biological characteristics of Perry Lakes. There is particular emphasis on the requirement for accurate depth-water surface area-volume curves when computing the mass, solute, isotopic and thermal balances. Due to their shallow depth (aided by much reduced area in summer) a grid of survey points marked by wooden pegs was established on 10×20 metre centres over each lake. Traditional optical levelling was used to measure each point to +/- 1mm accuracy, tied to government survey bench marks. At any lake stage (read to 1mm accuracy) a corresponding water volume and surface area could be generated.

The accurate relationship between water surface height (tied to a local topographic survey datum), water surface area and volume is essential for computing not just mass but also solute and isotopic balances. Surface area is essential for computing direct input from rainfall and evaporative loss. In thermal balances area is used in computing incoming and reflected short and long wave radiation, long wave radiation emitted from the water and heat in rain falling directly on the lake. At Perry Lakes the lake basin topography was determined in detail using a traditional grid of survey pegs and optical levelling. In East Lake (area 5.2ha) a total of 1080 individual surveyed points was used to accurately define the lake basin. Engineering software (originally designed to calculate open cut mine area and volume) was used to compute lake surface area and volume from dryness in 1mm lake stage increments. Such attention to accuracy was essential. Perry Lakes are very shallow basins. Small changes in lake stage produce large changes in water surface area.

Perry Lakes are considered to be Holocene features, formed when sea level stabilised and climate approached modern era conditions about 8,000 years B.P. The extent and thickness of the clay lining was mapped in both lakes using simple probing equipment. In East Lake this clay lining is in excess of 3m thick. Undisturbed core samples were extracted and lining stratigraphy correlated with Holocene data for the Swan Coastal Plain.

The geology and hydraulic conductivity of the local unconfined aquifer was investigated using extensive sieve analysis of drill samples plus pump and specific capacity tests. In situ undisturbed cores of lake basin sands and clay were extracted in large diameter PVC pipe and these pipes then used as permeameters to determine vertical hydraulic conductivity and specific yield (necessary for transpiration experiments). The unconfined aquifer is known to be far from uniform geologically. Piezometers drilled specifically for this study were probed with natural gamma and EM39 to map limestone, sand and calcrete associated with palaeo water tables.

Detailed botanical mapping was completed at West Lake over February 1995, 1996 and 1997. West Lake first dried out over summer 1995. The mapping confirmed that fringing emergent macrophytes constitute extremely dynamic plant communities which respond quickly to modified water regimes.

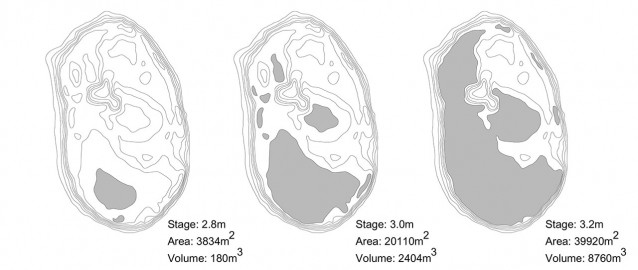
Incremental Stage Flood Maps (East Lake) demonstrate how small changes in lake stage equate to large changes in lake surface area in shallow basins. Flooded area is shown in grey tone. In urban wetlands with large inputs from stormwater drains, such changes can occur in a few minutes.

Chapter 4: Water Balance Concepts

A review of water balance concepts and historic efforts to measure groundwater components in the mass balances of Swan Coastal Plain wetlands. The limitations of simple mass balances are reviewed. On the basis of a mass balance alone groundwater can only be differentiated as a net input or loss. There is no way to differentiate or quantify groundwater discharge to the lake or lake recharge to the aquifer. The concept of simultaneous multiple rigorous balances is introduced. These are rigorous in the sense that (within practical limitations) every effort is made to measure every component of each balance. They are simultaneous in the sense that solute and isotope balances are calculated along with simple water mass. Integrating the balances allows the elusive groundwater flux components to be calculated. The detail on just how this is accomplished forms a large portion of Chapter 6.

Chapter 5: Water Balance Components

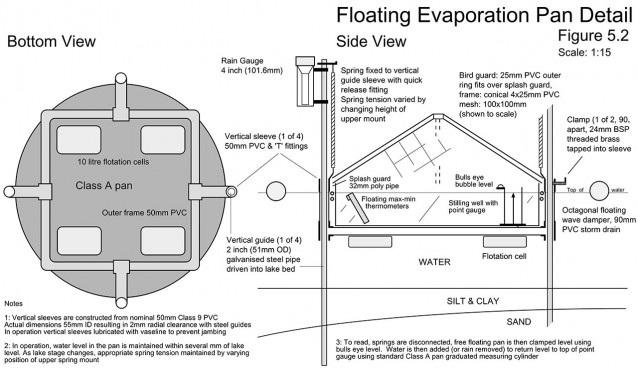
Describes the field techniques used to measure the principal water balance mass components and determine their solute and isotopic values. The decision to measure evaporation independently of the thermal balance required that a floating pan system be designed and engineered. The literature on floating pans is generally concerned with very large raft mounted installations. The design adopted for Perry Lakes included a bird guard with minimal wind and solar shading, stability without the use of rafts, provisions to increase floatation when heavy rain was forecast, a simple mechanism to level and stabilise the pan during readings and a wave damping mechanism.

Details of the floating pan designed and built specifically for Perry Lakes. One of the greatest disadvantages of floating pans is the fact that during heavy rain, the pan fills and rides lower in the water. High winds invariably associated with major frontal systems increase the likelihood of wave slop both into and out of the pan. In the Perry Lakes design these problems were circumvented in two ways. During winter when a frontal passage was forecast, spring tension was increased. This has the immediate effect of giving the pan greater freeboard, and preventing slop in. The pan was also equipped with an anti-slop ring or 'splash guard' around its rim and was surrounded by a floating wave damper. If significant rain was also forecast (>20mm), the water level in the pan was also lowered by 20-30mm prior to the frontal passage, preventing slop out. The spring assisted guides allowed the pan to move vertically through at least 0.5m in any 24 hour period, this being the typical lake stage change from storm water or summer top up. Over 13 months of continuous daily operation, only two days data were lost, once from flooding during an extreme rain event and once from flooding when the pan was inadvertently left in the 'locked' position after being read. Daily evaporation was read to 0.1mm using a standard Class A pan graduated measuring cylinder and adjusted for rainfall collected at the pan site.

Storm water enters Perry Lakes via 7 major drains and represents a significant component of the water balance. At first glance the problem appears simple. If the pipes are long, straight, debris free and of constant diameter, gradient and construction, then empirical techniques such as those derived by Chezy and Manning can provide useable estimates of open channel flow in pipes using simple empirical equations. This was the approach adopted at West Lake where 2 large drains were equipped with acoustic loggers which bounce an ultrasonic acoustic signal off the water surface and use the time delay of the returning signal to calculate distance to the water surface.

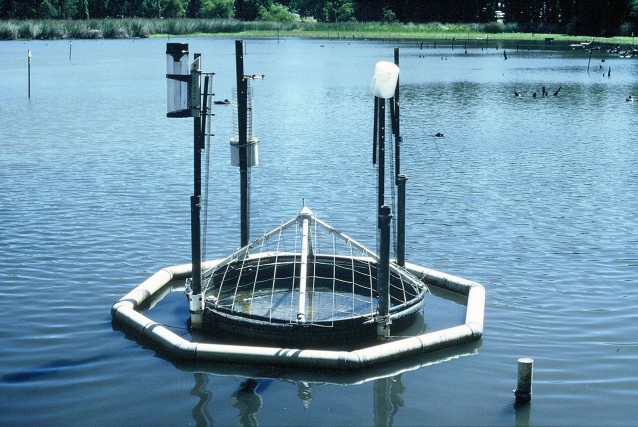
Floating Class A evaporation pan in operation.  This simple yet rigorous and independent measure of lake evaporation allowed us to resolve the sediment heat flux, a component usually ignored and demonstrate that in shallow wetlands and lakes, sediment heat flux is a significant component of the thermal balance.

Floating Class A evaporation pan in operation. This simple yet rigorous and independent measure of lake evaporation allowed us to resolve the sediment heat flux, a component usually ignored and demonstrate that in shallow wetlands and lakes, sediment heat flux is a significant component of the thermal balance.

Acoustic logger mounted in saddle trap over 920mm diameter storm drain, West Lake. The instrument could operate continuously for 2 months with readings every minute. Water depth could be resolved to +/- 1mm.

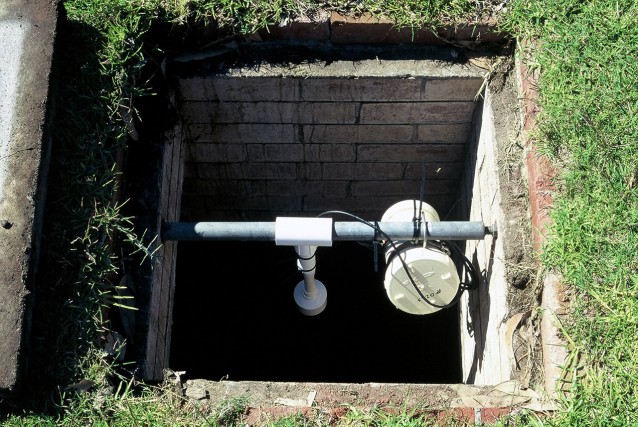
Drains entering East Lake varied from 225mm to 680mm diameter and presented significant difficulties. None provided access to undisturbed flow (i.e. West Lake style saddle traps). Instead they were built with square sediment traps. Generally several pipes entered the last trap, with a single pipe of larger diameter entering the lake. Observing these traps during storm events it was evident that there was a relationship between water level in the traps and water level in the exit pipe. The solution was to equip all sediment traps with capacitive water level loggers and then design an instrument to calibrate the simultaneous relationship between water depth in the trap and depth in the exit pipe.

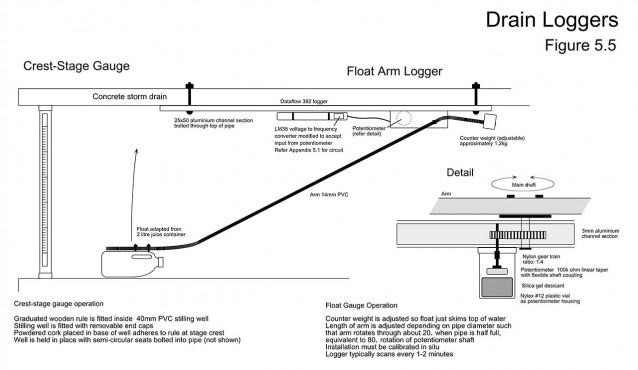
It was clear by the end of winter 1996 that the electronic data being collected in the sediment traps could not be adequately calibrated using either direct measure or crest-stage gauges. The final solution was to design and build a sensor which would continuously monitor water height in a pipe and log it electronically over short (minute or two minute) intervals. Data from one or two major storm events would be sufficient to calibrate the sediment trap loggers. The final design consisted of a counterweighted float and arm driving a potentiometer via a 1:4 gear train. The arm length was adjusted (depending on pipe diameter) such that flow at 0-90% of pipe diameter moved the arm through about 20° of rotation (thus maintaining the float horizontal to the water surface). Movement through this small rotational angle was multiplied via the gear train driving a potentiometer to provide increased resolution of small changes in depth. The counterweight was adjusted such that the float just skimmed the top of the water. A voltage to frequency converter and standard data logger were modified to accept input from the potentiometer.

Chapter 5 is a practical demonstration of how research often requires innovation and a bit of ‘hands on’ engineering skill. Both the floating pan and float arm drain logger were built from simple materials and cost very little. There was simply no commercially available gear that could have done the job.

Chapter 6: Water Balance Integration

Chloride is described as a conservative solute because its behaviour is simple and predictable and it does not fractionate during evaporation. Evaporating a closed body to half the original volume simply doubles the chloride content. Diluting the body with water of known chloride concentration permits the final concentration to be accurately predicted. Isotopes such as deuterium and oxygen 18 on the other hand are non conservative in that evaporation removes some of the isotope of interest. In a lake-aquifer system, isotope ratios are stable everywhere except at a lake surface where fractionation and enrichment occurs during evaporation. This behaviour or ‘isotope effect’ is governed by well defined rules which when applied allow these isotopes to be used in a similar fashion to conservative solutes. Knowing the isotopic ratio within the system components, mass balance equations can be solved to estimate the groundwater component in lake water balances.
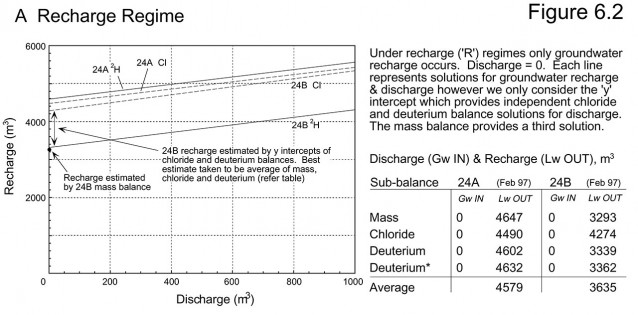
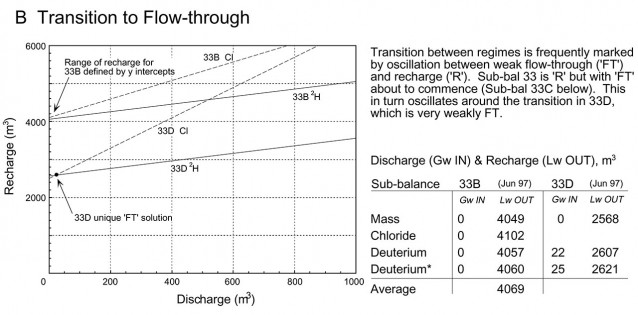
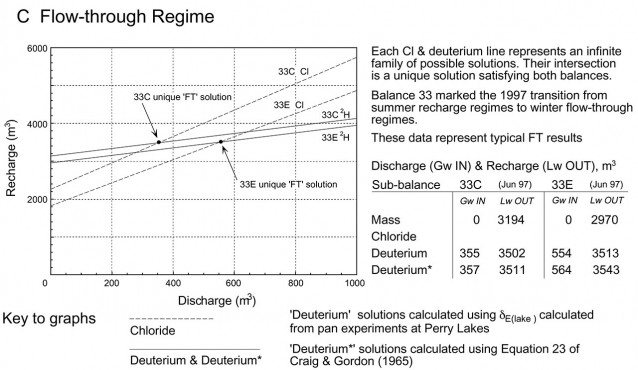
For any given balance period (in this study every 4 days) the linear equations for the chloride and deuterium balance each define a family of chloride balance and deuterium balance solutions where for any mass of groundwater discharged into the lake, a corresponding mass of lake water recharged to the aquifer, can be defined. Final balance integration was done algebraically by solving for the intersection of the two linear equations. Discharge and recharge calculated using empirically and experimentally determined δE typically varied by less than 2%. In the diagrams typical graphical solutions are presented for East Lake in recharge, flow-through and transition between the two. Each diagram shows the data for two 4 day sub-balance periods. In the accompanying tables ‘Deuterium’ refers to solutions employing δE(lake) calculated from pan experiments at Perry Lakes. ‘Deuterium*’ refers to solutions employing Equation 23 of Craig & Gordon (1965). Only the solutions employing the locally derived pan experiment exchange parameters are plotted on the diagrams.

February 1997, East Lake is being artificially maintained and is mounded above the unconfined aquifer. Lake water is recharged to the aquifer. No groundwater is discharged into the lake. The mass balance therefore contains only one unknown (recharge) which is solved as the residual of the mass balance. Similarly chloride and deuterium are solved for zero discharge. The chloride and deuterium solutions plot as parallel (or near parallel) lines, their y intercepts being recharge. Here mass, solute and isotope balances provide three independent estimates of recharge, allowing an average 'best estimate'.

The transition between regimes is marked by oscillation between weak flow-through and recharge.  These are common over winter when heavy rain and storm drain inputs push the lake into or close to recharge.  The temporal resolution of our integrated balances was four days.  At this scale it was not possible to resolve short term detail.

June 1997, winter rains have commenced. The transition between regimes is marked by oscillation between weak flow-through and recharge. These are common over winter when heavy rain and storm drain inputs push the lake into or close to recharge. The temporal resolution of our integrated balances was four days. At this scale it was not possible to resolve short term detail.

Groundwater is discharged into the lake and lake water is recharged to the aquifer. The mass balance therefore contains two unknowns and cannot be solved. Chloride and deuterium balance solutions plot as intersecting lines. The intersection (representing the solution to two linear equations) describes a unique solution satisfying the conservation of both chloride and deuterium.

June 1997, winter flow-through regimes re-established. Groundwater is discharged into the lake and lake water is recharged to the aquifer. The mass balance therefore contains two unknowns and cannot be solved. Chloride and deuterium balance solutions plot as intersecting lines. The intersection (representing the solution to two linear equations) describes a unique solution satisfying the conservation of both chloride and deuterium.

The single most significant result of the integrated balances was the non symmetrical nature of East Lake under flow-through conditions. It was assumed that groundwater discharge and recharge would be similar, more or less balancing each other. The data however show that recharge always exceeded discharge. This pattern was established early in the winter and prevailed over both 1996 and 1997. For most of each winter the lakes were always close to or approaching recharge status. The dividing stream line lay close to the up gradient shore in each lake, an observation confirmed experimentally using mini piezometers. It only required a small additional input of storm water to push the lake from flow-through into recharge status. The integrated balance data demonstrate the mechanisms and quantify the extent to which urban wetlands are hydrologically modified by storm water and other non natural inputs.

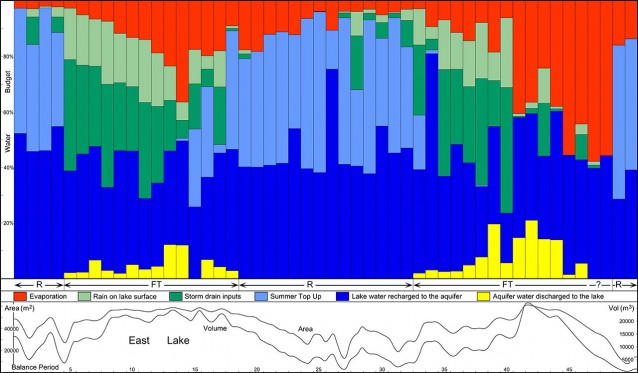
Principal mass components for East Lake plotted over 50 balance periods (April 22, 1996 to January 3, 1998). Average balance period was 12 days. Note that the mass components are plotted as a percentage of the total budget for each balance period NOT absolute quantities (refer next diagram).

Principal mass components for East Lake plotted over 50 balance periods (April 22, 1996 to January 3, 1998). Average balance period was 12 days. Note that the mass components are plotted as a percentage of the total budget for each balance period NOT absolute quantities (refer next diagram).

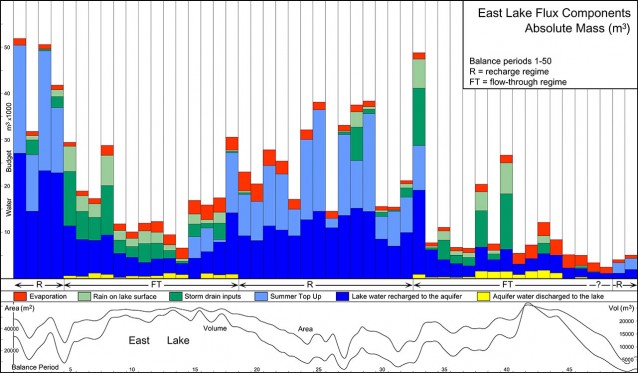
The same data plotted as absolute quantities. The data illustrate clearly how the lake mass budget is dominated by non natural inputs – storm water and summer top up. These push the lake either into or towards recharge flow regimes which eliminate or suppress groundwater discharge into the lake. It is surmised that prior to urbanisation flow-through regimes were maintained all year. During heavy rain events such lakes would move towards or possibly into recharge, but these excursions from flow-through would be transient. The annual trace of lake stage would approximate a smooth sinusoid, similar to seasonal fluctuations in the surrounding unconfined aquifer. Refer thesis for details.

The same data plotted as absolute quantities. The data illustrate clearly how the lake mass budget is dominated by non natural inputs – storm water and summer top up. These push the lake either into or towards recharge flow regimes which eliminate or suppress groundwater discharge into the lake. It is surmised that prior to urbanisation flow-through regimes were maintained all year. During heavy rain events such lakes would move towards or possibly into recharge, but these excursions from flow-through would be transient. The annual trace of lake stage would approximate a smooth sinusoid, similar to seasonal fluctuations in the surrounding unconfined aquifer. Refer thesis for details.

Chapter 7: Lake-Aquifer Interaction

The chapter commences with a comprehensive review of the literature and theory of lake-aquifer interaction. Flow-through lakes receive and release water over different parts of the lake bed. They represent the mid point in a continuum from recharge lakes (which release water to the aquifer over the entire lake bed) to discharge lakes (which receive groundwater over the entire lake bed). Using a network of 15 piezometers and 25 water table observation wells weekly flow nets were generated. These demonstrated how Perry Lakes oscillate between flow-through and recharge status in response to storm water inputs, artificial summer level maintenance and local groundwater extraction for lawn irrigation.

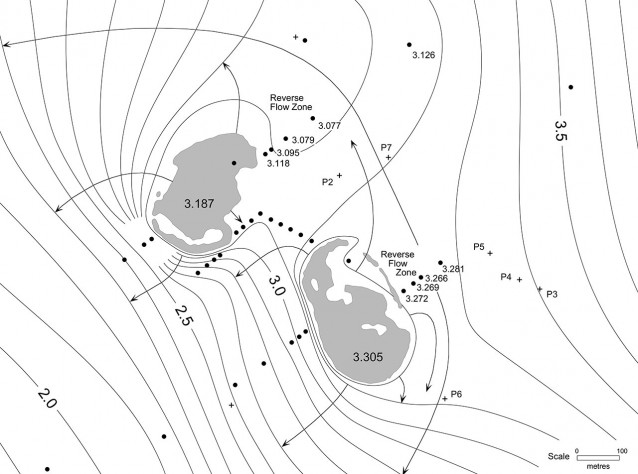
June 02, 1997. Typical flow regime following heavy rain (73mm over 3 days) and storm water inputs. Both lakes are mounded and recharging lake water back to the unconfined aquifer. This was an extreme case where the lakes share a common release zone. Black circles are monitoring wells, + symbols are irrigation bores. West Lake at top, East Lake at bottom. Figures in each lake are water surface height (m) above datum.

June 02, 1997. Typical flow regime following heavy rain (73mm over 3 days) and storm water inputs. Both lakes are mounded and recharging lake water back to the unconfined aquifer. This was an extreme case where the lakes share a common release zone. Black circles are monitoring wells, + symbols are irrigation bores. West Lake at top, East Lake at bottom. Figures in each lake are water surface height (m) above datum.

As winter rains set in, flow-through regimes become established in both lakes. Initially the capture and release zones for each lake are separate. As the water table reaches its winter maximum the capture and release zones merge.

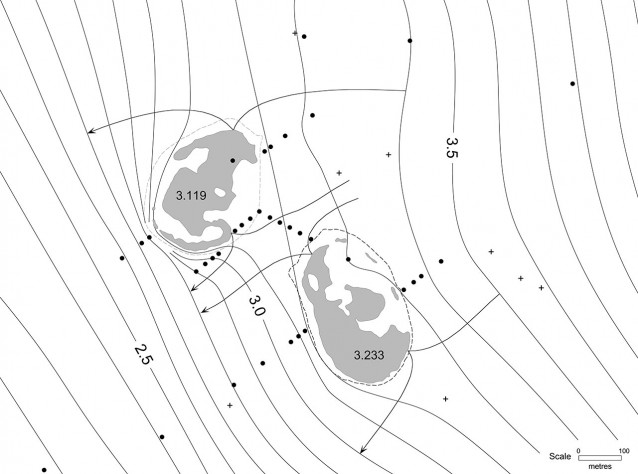
August 04, 1997. Typical early winter flow pattern. Flow-through regimes are established in both lakes with separate capture and release zones. Storm water inputs from storm drains have already mounded the lakes.

August 04, 1997. Typical early winter flow pattern. Flow-through regimes are established in both lakes with separate capture and release zones. Storm water inputs from storm drains have already mounded the lakes.

In a flow-through lake a ‘dividing stream line’ marks the boundary between the section of the lake bed receiving groundwater discharge and the section where lake water is being recharged back to the unconfined aquifer. In the example above, the dividing stream line runs through each lake with end points where the up gradient capture zone flow lines enter the lake and the down gradient release zone flow lines exit the lake. Notice that the position of the dividing stream line tends towards the up gradient side of each lake. This occurs because storm water inputs are constantly pushing the lake towards recharge. The area of the lake bed recharging water back to the unconfined aquifer is much greater than the area of the lake bed receiving discharge from the aquifer.

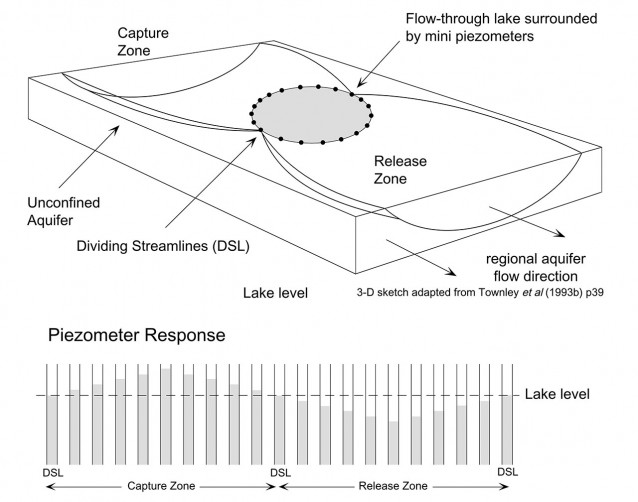
Chapter 7 also details field experiments conducted during the approach to summer 1997-1998. As the rains diminished the local unconfined aquifer began declining and East Lake began shrinking. Under an agreement with the wetland managers the lake was allowed to approach complete dryness before summer top up maintenance commenced. Using mini piezometers installed around the lake margin it was possible to document on a daily basis changes in the position of the dividing stream line. The theory behind this experiment is shown in the following diagram.

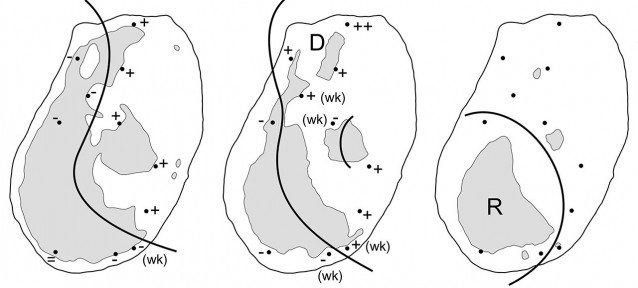
In a flow-through lake the dividing streamlines occur where the piezometric head is equal to the lake surface. If piezometers are installed around such a lake, their response will defined by positive piezometric heads in the capture zone and negative piezometric heads in the release zone.

In a flow-through lake the dividing streamlines occur where the piezometric head is equal to the lake surface. If piezometers are installed around such a lake, their response will defined by positive piezometric heads in the capture zone and negative piezometric heads in the release zone.

The mini piezometers were monitored over two months. The piezometers were read (and often relocated) on a daily basis to follow both the position of the dividing streamline and the receding shoreline as East Lake approached dryness. Using a small hand operated sludge pump, a mini piezometer could be installed in about 5 minutes. They were always installed in the lake just a few metres from shore. Using the lake surface as a datum, positive or negative piezometric heads could be observed and measured quickly. Typical data from the experiment are shown below.

Left: November 16, Centre: December 04, Right: January 04.

Left: November 16, Centre: December 04, Right: January 04.

Individual mini piezometers are shown as dots, with piezometric heads indicated as positive or negative relative to the lake surface level. On November 16 East Lake is still weakly mounded (the result of late season rain and storm water inputs. The dividing stream line is located close to the up gradient side of the lake. The lake is in flow-through but tending towards recharge. The integrated balance for the period November 11-22 confirms this. Recharge to the aquifer was 1850 m³ while groundwater discharge into the lake was just 270 m³. In December the lake shrinks further and leaves small remnant ponds. Initially these displayed positive piezometric heads around their entire periphery and acted as small discharge lakes. Eventually flow-through conditions became established in some ponds. The lake shrank to almost total dryness and the wetland managers commenced artificial summer maintenance December 20. Under these conditions the lake is permanently mounded above the water table. Lake water is recharged back to the aquifer over the entire lake bed.

Chapter 7 concludes with a discussion of the practical issues surrounding artificial lake level maintenance on the Swan Coastal Plain. By way of example, we were able to demonstrate that at Perry Lakes the hydraulic conductivity of the lake lining doubles over summer when lake water temperatures can reach 40 deg. C. For wetland managers struggling to maintain water levels over summer, the cards are stacked against them. The lake is the visible top of a local groundwater mound which pumping attempts to maintain against a falling regional water table, locally depressed further by pumping, increased transpiration and open water evaporation. The rate of mound decay is further enhanced by reduced water viscosity and higher effective lining hydraulic conductivity.

Chapter 8: Thermal Balance

A thermal balance relies on the measurement of all sources of incoming and outgoing thermal energy plus changes in energy storage. It is considered to be one of the most accurate methods for estimating evaporation from a water body when integrated over long periods of time. In such studies all thermal terms are measured except evaporation. The residual in the balance is then considered to be the heat used to evaporate water. In many studies however, heat advected in the difficult to measure ground water components (discharge into the lake and recharge from the lake back to the aquifer) are either ignored or poorly estimated. Likewise heat conducted from the lake into the sediments and from the sediments back into the water column has been generally ignored. Heat flux from sediments can comprise a significant source of heat to the water. Reviews of the literature confirmed that the heat flux to and from the sediments had been addressed in only a few studies.

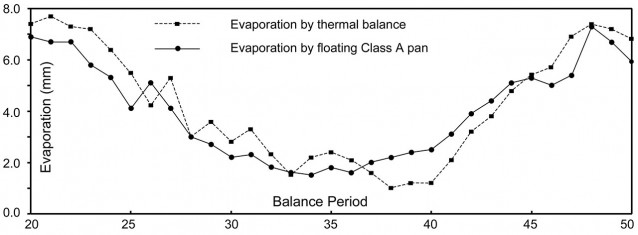
At East Lake evaporation was measured directly by floating pan. Likewise groundwater components were independently measured and their temperature throughout the year well documented. Therefore heat used for evaporation and heat transported via groundwater were known. The thermal contribution of the lake sediments could then be estimated as the balance residual. For the year 1997, total East Lake evaporation (measured by floating Class A pan) was 1378.8mm. Ignoring the sediment term, the thermal balance estimate of evaporation was 1468.4mm, an over estimate of 6.5%. Over a year, much of the error is cancelled because the thermal balance both over and under estimates evaporation however within individual balance periods (typically 12 days) the error was much greater, ranging from 50.9% over estimate (Balance 34) to -53.1% under estimate (Balance 38). Expressed as daily evaporation, the average daily error over 1997 was 0.24mm however within individual balance periods this rose as high as 1.54mm (diagram below).

Average daily evaporation measured by floating Class A pan and computed from thermal balance ignoring sediment heat flux (Qse). The difference is the error in evaporation (in mm) when sediment heat flux is ignored. The data covers balance periods 20 to 50 (December 22, 1996 to January 3, 1998).

Average daily evaporation measured by floating Class A pan and computed from thermal balance ignoring sediment heat flux (Qse). The difference is the error in evaporation (in mm) when sediment heat flux is ignored. The data covers balance periods 20 to 50 (December 22, 1996 to January 3, 1998).

Chapter 9: Thermal Regimes in Wetland Sediments

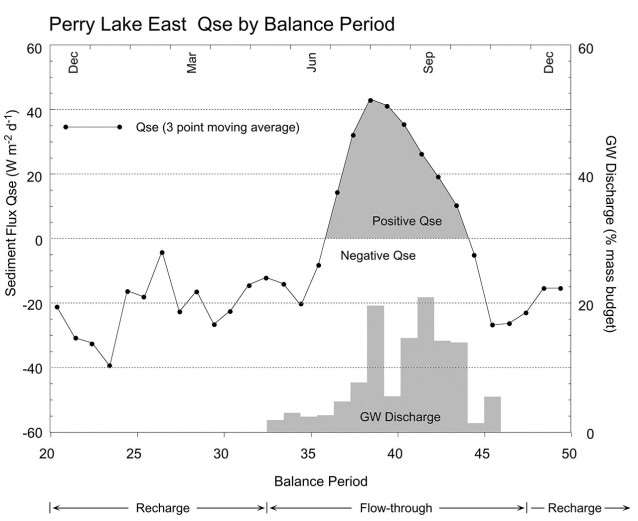
This chapter investigates and expands upon the difficulties inherent in directly measuring the sediment heat flux (Qse) and discusses its importance in the thermal balance of shallow wetlands. Concepts of conducted and advected heat flow are introduced and applied to the Perry Lakes data. The thermal patterns in East Lake sediments are presented and used to demonstrate how these reflect daily and seasonal changes in lake-sediment and lake-aquifer interaction. In East Lake the sediments act as a large heat sink over summer. During winter much of this stored heat is conducted back to the water column as shown below:

Daily average sediment heat flux (Qse) plotted for balance periods 20-50. GW discharge corresponds to the winter period when East Lake is in flow-through.

Daily average sediment heat flux (Qse) plotted for balance periods 20-50. GW discharge corresponds to the winter period when East Lake is in flow-through.

At first sight it might be tempting to equate this seasonal feedback with the period of flow-through shown as GW (ground water) discharge in the shaded bar graph, however it is more likely that this has always occurred even when the lake was flow-through all year. This interpretation is based on the fact that the phenomenon is well documented for temperate Northern Hemisphere lakes most of which are water table lakes in which both groundwater discharge and lake seepage are described.

In East Lake 10 thermistor strings were installed in the sediments. Each string had thermistors spaced from the water-sediment interface to 7m depth, 9 thermistors per string, 90 in total. Thermistors were read daily. The data displayed diagrammatically in Chapter 9  show how heat is both conducted and advected in different sections of the lake basin in response to changes in lake state from flow-through to recharge.

Chapter 10: Evaporation Studies

A Class A pan was operated adjacent to Perry Lakes and a floating Class A pan was operated within East Lake. Open air swimming pools were also monitored as these effectively act as large sunken evaporation pans. Detailed monthly pan to lake coefficients are presented along with comparisons with other Class A pans operated by the Bureau of meteorology and others. The Perry Lakes data presented here represents one year for one wetland. Truly useful data can only be obtained from many years of consistent monitoring. Despite this, they are the only accurate lake-pan coefficients ever developed for Swan Coastal Plain wetlands. Due to their shallow depth, coastal wetlands have a low heat storage. Therefore the lake to pan phase lag should be much less pronounced than with deep water bodies and the errors from applying pan coefficients on a monthly basis should be reduced. This study represents the first attempt to accurately measure evaporation from a Swan Coastal wetland and provide accurate coefficients tied to the Bureau of Meteorology pan at Perth Airport.

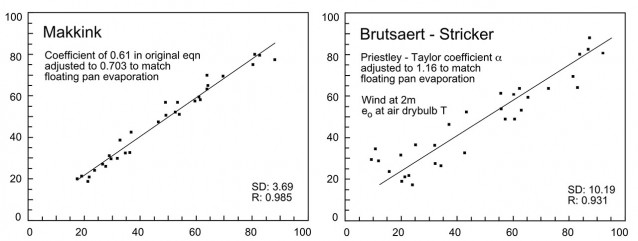
The second half of Chapter 10 is a detailed comparison of 10 commonly applied empirical equations for estimating evaporation or potential evapotranspiration. Equations tested were the Makkink, Stephens-Stewart, Jensen-Haise, Hamon, DeBruin, Mass Transfer, Penman, DeBruin-Keijman, Priestley-Taylor and Brutsaert-Stricker. Comparing methods on a balance period basis essentially shows how well the method copes with seasonal variations. All equations are essentially linear in form and can be adjusted against evaporation measured independently either by adjusting an existing coefficient or introducing a local coefficient of proportionality. Each equation was adjusted to produce a total annual evaporation equivalent to the floating Class A pan. Balance period totals were plotted against the corresponding floating pan data. The best and worst performers are shown below.

Best performer was the Makkink. SD is the standard deviation of the difference between floating pan values (x axis) and estimates derived from the equation (y axis). The Brutsaert-Stricker was the worst performer.

Best performer was the Makkink. SD is the standard deviation of the difference between floating pan values (x axis) and estimates derived from the equation (y axis). The Brutsaert-Stricker was the worst performer. Data points are balance periods 20 to 50 (December 22 1996 to January 3 1998).

Depending on what height wind run is taken and other factors such as using air or surface water temperature to calculate the saturated vapour pressure meant that some equations could be calculated in a number of different ways. Chapter 10 compares a total of 25 methods based on the 10 basic empirical equations noted above.

Chapter 11: Transpiration

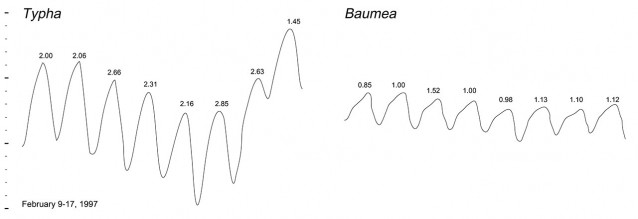
Much of the Perry Lakes basins contain emergent wetland macrophytes, in particular Typha and Baumea. It was important to quantify how much transpiration might introduce errors into the mass balances. High resolution capacitive water level loggers were operated in shallow wells bored into the lake lining clays in a Typha meadow (East Lake) and a Baumea meadow (West Lake). The specific yield (0.024) and the readily available (within first 24 hours) specific yield (0.0069) were measured. The method relies on the fact that groundwater levels below phreatophytes typically fluctuate diurnally in a harmonic form and can be used to provide daily estimates of water uptake by plants.

The Typha data was collected over a full year during which evapotranspiration totalled 383mm compared to 1385mm from adjacent open water as measured by floating Class A pan. In December average daily Typha evapotranspiration was 2.0mm compared to 6.6mm evaporation from adjacent open water. In September (when Typha is dormant) this dropped to just 0.1mm compared to 2.9mm for open water. The Baumea was only monitored for February and March 1997 and showed evapotranspiration rates about half that of Typha.

Water table fluctuations below Typha and Baumea meadows for the same period in February 1997. Figures above each peak are the evapotranspiration in mm calculated for the previous 24 hours. Vertical scale is 100mm between heavy ticks.

Water table fluctuations below Typha and Baumea meadows for the same period in February 1997. Figures above each peak are the evapotranspiration in mm calculated for the previous 24 hours. Vertical scale is 100mm between heavy ticks.

Chapter 12: Isotope Experiments

To determine the isotopic water balance of a lake the critical parameters are δE, the isotopic composition of water vapour evaporating from the lake surface and δA, the isotopic composition of water vapour in the local air mass. In many such studies δE is simply estimated using empirical formulae. These in turn require knowing (among other things) δA and δL, the isotopic composition of the lake water. Again δA is often simply estimated from the literature. At Perry Lakes the isotopic value of each balance component was measured directly. This included rainfall (each rain event), lake water (every 4 days) and top up water (each time groundwater was pumped into the lake).

Due to the time and expense involved in measuring δA little detail is known regarding the isotopic composition of water vapour generally over Australia. In general δA varies diurnally (primarily in response to humidity) and seasonally in response to varying air mass provenance. At Perry Lakes δA was measured directly on a weekly basis by freezing out the water vapour in traps chilled to -60 degrees C. A total of 108 samples and δA determinations were completed over the study period.

Evaporation pans can be used to estimate δE. The literature describes two basic approaches. In the first pans are allowed to approach dryness. Water in the pan then approaches a limiting steady state composition designated δS. In the second approach pans are evaporated at constant volume i.e. as water is evaporated from the pan it is replaced with water of a known isotopic composition. The water in such pans will also reach a limiting steady state (designated δK). Both δS and δK vary with humidity and δA. When pans are evaporated over days or weeks, the steady state values reflect the prevailing average atmospheric conditions including humidity and δA. The resulting steady state values are said to be ‘flux weighted’ in that they reflect the sum effect of the varying exchange and evaporative processes occurring over time. If such pan experiments are conducted continuously over a year, the resulting steady state compositions of the pan water will constantly change, reflecting the seasonal variations in humidity, δA and other atmospheric conditions. If such experiments are conducted beside a lake and if the water in the pans is subjected to the same atmospheric conditions as the lake, then δS and δK measured in the evaporation pans can be used to estimate δE for the adjacent lake.

The Perry Lakes pan exchange parameters experiments comprised two small pans mounted within larger thermal regulation pans. Water from the adjacent lake was continuously pumped into these outer pans so that their temperature was always equal to that of the lake. The isotope experiment ran continuously from March 29, 1996 until February 14, 1998 and comprised 20 separate time course runs (20 for each pan, 40 in all) over 688 days or almost two years of flux weighted evaporation data. Mean run time was 34 days.
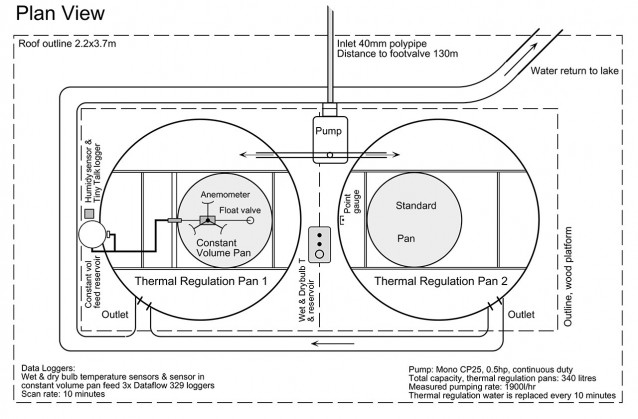
Fig. 12.4 Plan View
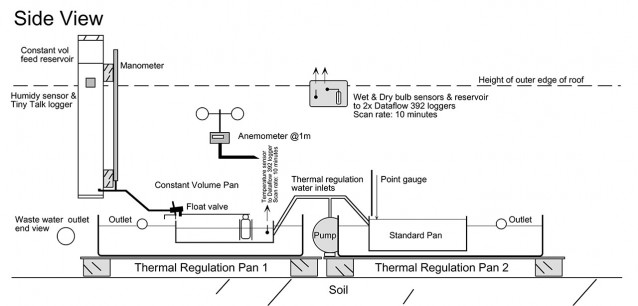
Fig. 12.4 Plan View

Fig. 12.4 Side View
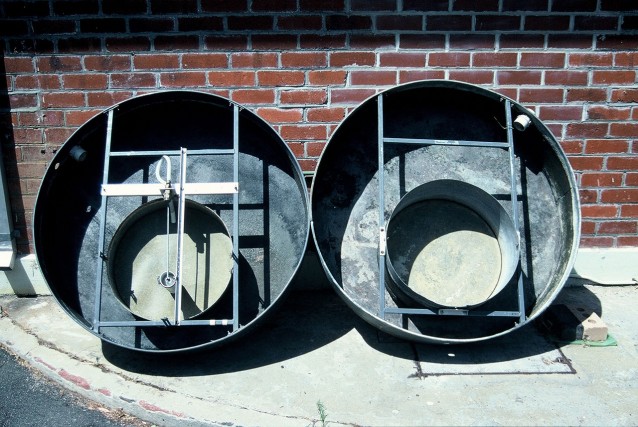
Fig. 12.4 Side View

Basic pan experiment layout, photographed after pans were decommissioned, February 1998. The experiment pans are mounted eccentrically within the Class A thermal regulation pans. The eccentric mount pattern kept the pans close to the centre of the shelter, precluding rain contamination of the experiments. Lake water circulated through the outer pans at about 1900 litres/hr and kept the experiment pans within 1 degree C of lake surface temperature.
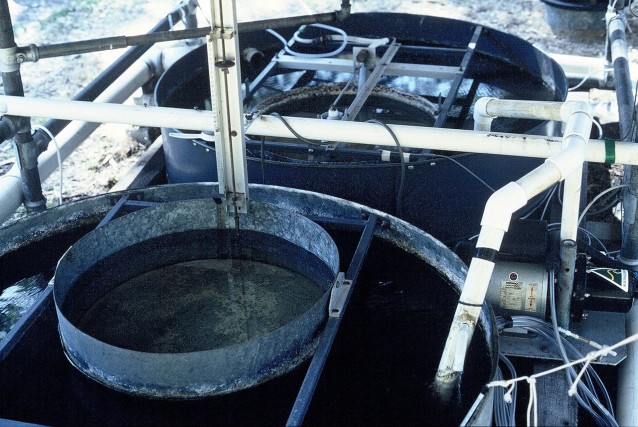
Basic pan experiment layout, photographed after pans were decommissioned, February 1998. The experiment pans are mounted eccentrically within the Class A thermal regulation pans. The eccentric mount pattern kept the pans close to the centre of the shelter, precluding rain contamination of the experiments. Lake water circulated through the outer pans at about 1900 litres/hr and kept the experiment pans within 1 degree C of lake surface temperature.

Pan evaporated to dryness.  The daily evaporation from the pan was read using a ‘point gauge’ visible behind.  It comprised a threaded brass rod machined to a fine point plus a brass disk mounted on the rod whose position could be sighted against a fixed scale allowing evaporation to be read directly in mm.  In operation the rod was screwed down until the tip contacted the water surface, with evaporation then read directly off the scale.
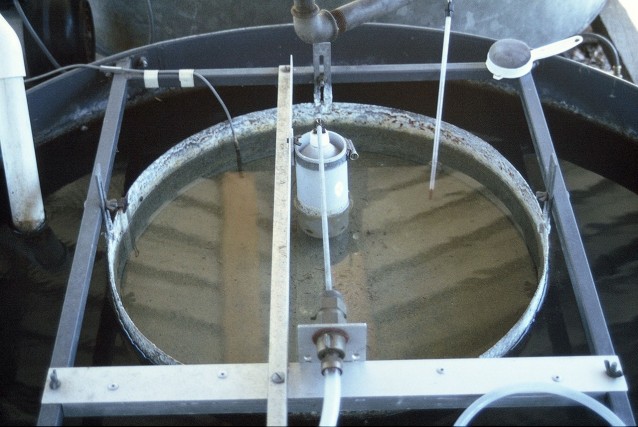
Pan evaporated to dryness. The daily evaporation from the pan was read using a ‘point gauge’ visible behind. It comprised a threaded brass rod machined to a fine point plus a brass disk mounted on the rod whose position could be sighted against a fixed scale allowing evaporation to be read directly in mm. In operation the rod was screwed down until the tip contacted the water surface, with evaporation then read directly off the scale.

Pan evaporated at constant volume. Thermal regulation water enters outer pan via the white pipe on the left. As evaporation proceeds, the water level in the pan is maintained constant via the float (in stilling well) and valve (foreground). Thermistor (left rear) connects to data logger, checked daily against a glass laboratory thermometer, (right rear). The float and valve were fed by a small volume, manometer equipped reservoir built from PVC pipe. Daily evaporation could be read to 0.1mm accuracy.
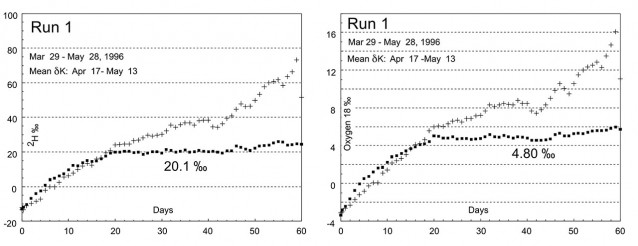
Typical deuterium time course for pan evaporated at constant volume (rectangles) and pan evaporated to dryness (+ symbols). This first run was allowed to run longer than necessary. At the height of summer steady isotopic state was frequently achieved in the constant volume pan in about 12 days. Constant volume steady state (δK) can be read directly, in this case 20.1‰. Oxygen 18 time course is also shown for the same period. Initially pans were sampled and analysed every day (Runs 1-11) while Runs 12-20 were analysed every second day. Water evaporated in the pans was groundwater of similar isotopic composition to water naturally discharged into East Lake under flow-through conditions.
Typical deuterium time course for pan evaporated at constant volume (rectangles) and pan evaporated to dryness (+ symbols). This first run was allowed to run longer than necessary. At the height of summer steady isotopic state was frequently achieved in the constant volume pan in about 12 days. Constant volume steady state (δK) can be read directly, in this case 20.1‰. Oxygen 18 time course is also shown for the same period. Initially pans were sampled and analysed every day (Runs 1-11) while Runs 12-20 were analysed every second day. Water evaporated in the pans was groundwater of similar isotopic composition to water naturally discharged into East Lake under flow-through conditions.

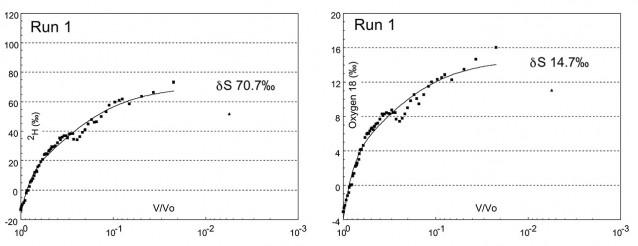
Determination of steady state (δS) for deuterium in pans evaporated to dryness. The x axis is the ratio of pans volume V at time t over initial volume V0 at time t0. Steady state δS is the value of the curve extrapolated to V/V0 = 0.0001. Second graph shows similar data for Oxygen 18. The final data point (plotted as a triangle in both graphs) is ignored. As dryness is approached salt in the pan water crystallises and absorbs atmospheric moisture corrupting the final value.

The Perry Lakes isotopic balances are unique in that they employ isotopic exchange parameters measured directly at the study site (such as δA) or determined experimentally specifically for the study site (δS, δK and δE).

Chapter 12 ends with details of experiments carried out to measure δE directly. On cold still mornings at Perry Lakes vapour is frequently visible rising from the warmer water into the cooler air (refer Home Page). This is evaporated lake water vapour, made temporarily visible through condensation. The vapour only becomes visible some distance above the lake surface. Immediately above the lake surface the air is warmed by the water and no vapour is visible. We postulated that if air from this layer could be sampled without allowing any fractionation, it would provide a means of directly measuring the isotopic composition of water vapour evaporating from the lake surface, δE. A floating sampler was devised (refer photo). The vapour was collected by freezing it out in traps chilled to -60 degrees C using the same equipment employed for δA sampling (a δA sample was always collected concurrent with a δE sample). By maintaining the sampling feed line in the water column and even warmer bottom mud, condensation (and hence isotopic fractionation) was precluded.
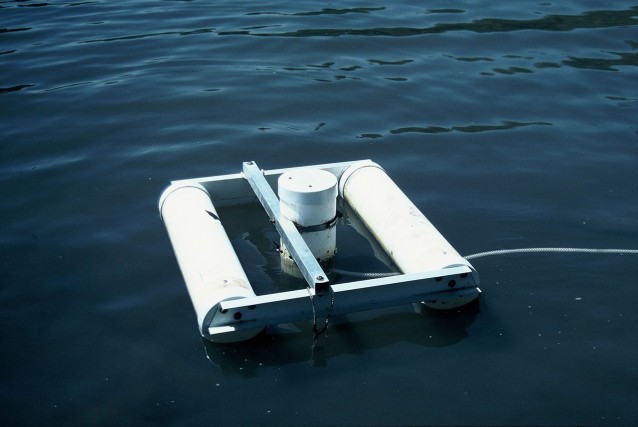
Floating pick up for direct field measurement of the isotopic composition of evaporated lake water δE. Vapour was drawn in from holes about 10mm above the water surface. The sample line was maintained in the warmer water precluding condensation (and isotopic fractionation).

Floating pick up for direct field measurement of the isotopic composition of evaporated lake water δE. Vapour was drawn in from holes about 10mm above the water surface. The sample line was maintained in the warmer water precluding condensation (and isotopic fractionation).

A total of 21 samples were collected over 14 months. Sampling could only be done opportunistically on windless, cold nights, typically between midnight and dawn. Refer thesis for details. Certainly these field experiments were valuable in confirming that directly measured δE is in many cases similar to δE calculated by other means. The experiments provided some confidence that δE derived experimentally from the pan experiments could be applied to the isotopic balance calculations.
Chapter 13: Climate, Urbanisation and Wetlands

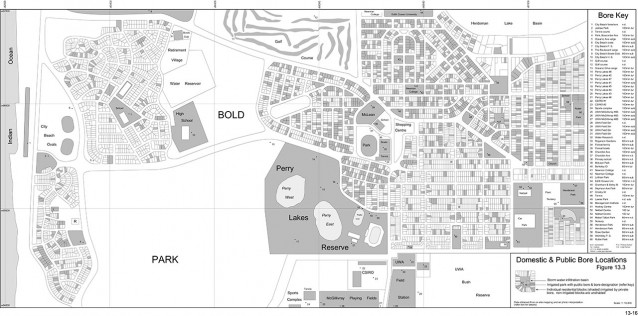
This chapter examines the issue of declining water levels which have plagued the wetland managers at Perry Lakes since the 1960’s. Perry Lakes of course is part of the Perth metropolitan area and water level problems need to be evaluated within the larger context of a rapidly expanding city and issues such as global warming and long term reduced rainfall over the SW part of Western Australia. Perth has a Mediterranean climate but indulges in European temperate gardens and huge areas of lawn. This is only possible because most of Perth is a ‘Non proclaimed’ water management area. Any homeowner has the common law right to sink a private bore and extract groundwater with no licence or requirement to notify any government authority or requirement to metre the amount of water withdrawn. There are probably somewhere between 150,000 and 200,000 private bores in the metropolitan area.

Regional water balance models were constructed for an area of about 9 square km around Perry Lakes. All groundwater extraction bores in the area were mapped. This included bores installed by private home owners and larger bores in parks and reserves, university grounds etc. The models confirm that the average 50mm annual decline in the water table observed over the past 40 years is entirely consistent with the imbalance between extraction and recharge. The models suggest that under prevailing rainfall conditions of 700mm per year bore extraction may have exceeded recharge by about 550,000m³ an amount equivalent to 220 Olympic size swimming pools in the small model area alone and equating to a 50-60mm annual water table decline.

As far as we are aware the bore mapping project is the only one of its kind ever attempted in the Perth metropolitan area. The final map is included for download within Chapter 13 as three A4 PDF pages. The entire map can also be viewed in reduced detail below (click to enlarge).

Chapter 14: Future Management

This chapter examines numerous options for addressing the hydrological issues at Perry Lakes. Many are applicable to the Perth metropolitan area and beyond. Given the fact that decreasing rainfall is a present fact and future expectation, the key issue is largely one of reducing groundwater extraction. Issues addressed include bore licensing, public education, urban design and planning, and engineered solutions such as the use of tertiary treated waste water.

Chapter 15: Concluding Summary

This study is a very detailed and holistic examination of one wetland system. The principal conclusions and observations therefore cover a wide range of topics. Some are specific to Perry Lakes while others are more general and have application to other wetlands, in particular those on the Swan Coastal Plain. Chapter 15 summarises the principal conclusions or observations made in Chapters 6-14 including recommendations for future study and wetland management.